
pH & EC Visualisation Made Easy: Charts, Graphs & Best Practices
Monitoring pH and EC is essential for healthy hydroponic systems. These two metrics directly affect nutrient absorption and plant health. Here's what you need to know:
- pH: Measures acidity/alkalinity (scale 0–14). Ideal range is slightly acidic for most crops.
- EC: Reflects nutrient concentration (measured in mS/cm). Keep it balanced to avoid nutrient deficiencies or burns.
Key Takeaways for Australian Growers:
- Challenges: High temperatures (e.g., Queensland) increase evaporation, raising EC. Variable water quality affects pH and EC.
- Solutions: Frequent monitoring, pre-treating water, and using cooling systems can help.
Tools for Monitoring:
- Basic Tools: Digital pH meters and EC probes (accurate but need regular calibration).
- Advanced Systems: Automated wireless sensors, cloud storage, and mobile apps for real-time monitoring.
Data Visualisation:
- Use line graphs for trends, scatter plots for correlations, and set up alerts for quick responses.
- Monitor crop-specific target ranges (e.g., lettuce: pH 5.5–6.5, EC 1.2–2.4) and adjust gradually to avoid plant stress.
Regular checks, clear data visualisation, and timely adjustments are vital for maintaining optimal hydroponic conditions in Australia's unique climate.
IoT-Based Hydroponic Monitoring System Demo 🌱 | Smart ...
Measurement Tools and Equipment
Measurement tools for hydroponics range from simple handheld devices to advanced digital systems designed for continuous monitoring. Each type suits different monitoring needs, depending on the scale and complexity of your setup.
Basic Testing Equipment
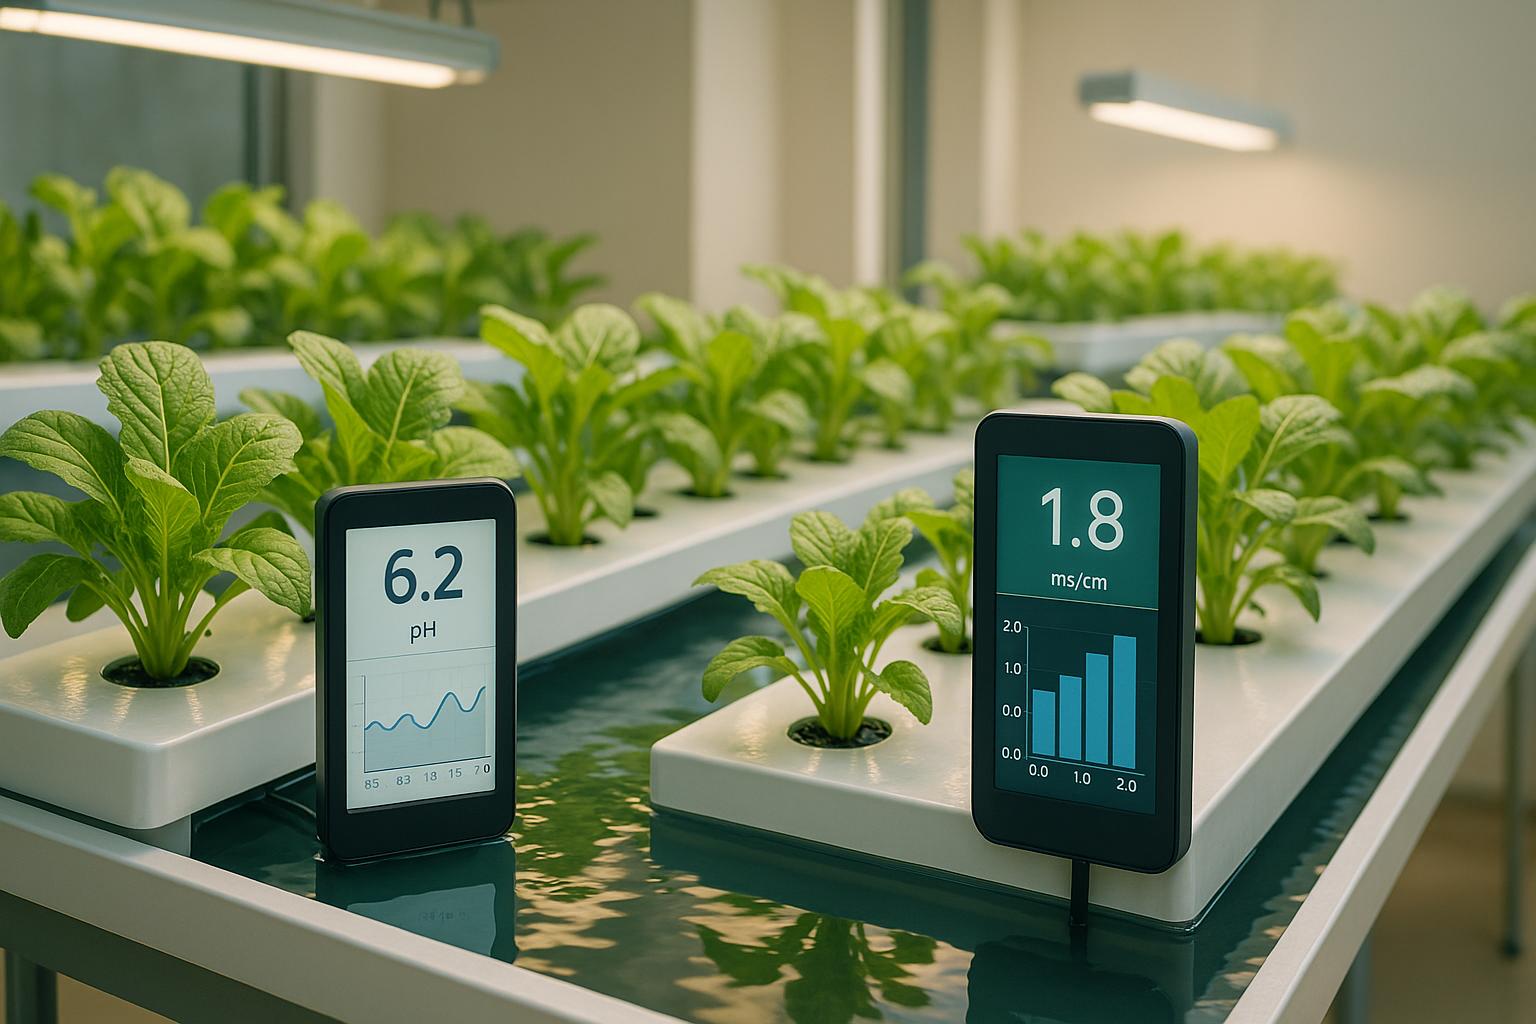
For hydroponic systems, tools like pH meters and EC probes are must-haves. Regular calibration is crucial to maintain accurate readings. Digital pH meters provide quick results with a precision of 0.1 pH units, while EC meters measure electrical conductivity in millisiemens per centimetre (mS/cm).
Here’s a breakdown of commonly used basic tools:
| Equipment Type | Measurement Range | Typical Accuracy | Calibration Frequency |
|---|---|---|---|
| Digital pH Meter | 0-14 pH | ±0.1 pH | Weekly |
| EC Probe | 0-10 mS/cm | ±2% | Monthly |
| Combo Meters | 0-14 pH / 0-10 mS/cm | ±0.1 pH / ±2% | Fortnightly |
While these tools cover the basics, advanced systems can simplify monitoring even further.
Digital Monitoring Systems
Digital systems bring automation and convenience to hydroponic monitoring. These systems often include:
- Wireless Sensors: Send live pH and EC readings to a central device.
- Cloud Storage: Automatically saves data for easy trend tracking.
- Mobile Apps: Let you monitor and manage alerts remotely.
- Data Export Features: Simplify detailed analysis using spreadsheet software.
For larger hydroponic setups, automated systems can oversee multiple nutrient reservoirs at once, offering a comprehensive view of operations.
Selecting Measurement Tools
Choosing the right equipment depends on your specific needs. Keep these factors in mind:
- Accuracy: Professional setups may require laboratory-grade tools with ±0.05 pH accuracy.
- System Size: Small-scale growers might only need handheld meters, while larger operations benefit from automated systems.
- Environmental Conditions: Ensure your equipment is built to handle Australia's high humidity and temperature fluctuations.
To keep your tools reliable, calibrate them regularly and clean sensors with distilled water before storage.
Data Display Methods
Graph Types and Uses
Line graphs are ideal for tracking changes in pH and EC over time. To make trends and correlations easier to spot, use the primary Y-axis for pH and a secondary Y-axis for EC readings.
Here are some other graphing options to consider:
| Graph Type | Best Use Case | Key Benefit |
|---|---|---|
| Line Graph | Monitoring continuous trends | Shows gradual changes clearly over time |
| Scatter Plot | Examining data correlations | Highlights relationships between pH and EC |
| Bar Chart | Comparing aggregated data | Summarises data over specific time intervals |
| Heat Map | Visualising multi-zone data | Displays variations across different zones |
These visual tools are essential for creating an effective monitoring display.
Building Monitoring Displays
An effective monitoring display should include:
- Real-time pH and EC readings to keep you updated on current conditions.
- Trend lines showing changes over the past hours.
- Historical averages to compare current readings with your target ranges.
Be sure to use local measurement standards to ensure consistency.
Once your display is ready, it's time to set up alert systems for quick responses.
Setting Up Alert Systems
Colour-coded indicators can make it easier to interpret your data at a glance:
- Green: Conditions are within the optimal range.
- Amber: Values are approaching your set thresholds.
- Red: Immediate action is required.
For added convenience, automated SMS or email alerts can notify you when readings move outside your desired ranges.
If you're looking for reliable monitoring tools and guidance tailored to Australian growing conditions, check out Green Genius (https://greengenius.com.au). They offer solutions designed to meet local needs.
Reading and Using Data
Use the data below to fine-tune your hydroponic system settings for better results.
Target Ranges by Crop Type
Here are recommended pH and EC ranges for some popular hydroponic crops:
| Crop | Growth Stage | pH Range | EC Range (mS/cm) | Notes |
|---|---|---|---|---|
| Lettuce | Vegetative | 5.5–6.5 | 1.2–2.4 | Lower EC during summer months |
| Tomatoes | Fruiting | 5.8–6.8 | 2.5–5.0 | Increase EC during fruit setting |
| Strawberries | Mature | 5.5–6.2 | 1.4–3.0 | Reduce EC in hot weather |
| Basil | Vegetative | 5.5–6.0 | 1.5–2.2 | Higher EC boosts oil production |
Making System Changes
If your readings fall outside these ranges, make gradual adjustments to avoid shocking the plants.
- pH Corrections: For high pH levels, especially in hard water areas like Western Australia, add 1 mL of citric acid per litre of water. If pH is too low, use 0.5 mL of food-grade potassium hydroxide per litre. Wait two hours before retesting the pH.
- EC Adjustments: To lower EC, dilute the nutrient solution by 25%. To raise it, add a quarter-strength nutrient mix. Always retest after making changes.
Monitoring Schedule
Tailor your testing routine to Australia's seasonal conditions:
| Season | Testing Frequency | Best Testing Times | Key Considerations |
|---|---|---|---|
| Summer | Twice daily | 7:00 AM, 4:00 PM | Check after heatwaves |
| Winter | Once daily | 10:00 AM | Retest after greenhouse warms up |
| Spring/Autumn | Once daily | 9:00 AM | Be alert to sudden temperature fluctuations |
This schedule, combined with automated alerts, helps maintain stable conditions.
"NSW growers report an 18% increase in basil oil content with staged monitoring schedules", according to a study by the NSW Department of Primary Industries.
For systems holding over 1,000 litres, consider testing more frequently in the hour following nutrient adjustments. Commercial growers in Tasmania have seen 30% fewer nutrient-related problems by following this practice, especially during winter when temperature shifts are more pronounced.
These methods can help streamline your system's performance.
System Improvements Through Data
Use the data you collect regularly to make targeted adjustments and improve your system's performance.
Preventing Nutrient Issues
Keep an eye on pH and EC trends to spot nutrient imbalances early. If your records show consistent increases or unexpected shifts, it's time to review your nutrient solution and water quality - especially during periods of extreme heat. Staying ahead of these issues helps maintain healthy crops and supports better yields.
Boosting Yields
Fine-tune your system to get the most out of your crops:
- Keep an eye on solution temperature to ensure nutrients are absorbed effectively.
- Track daily pH and EC trends to catch any irregularities.
- Adjust system settings quickly to align with changing weather conditions.
Expert Assistance
For advanced systems, professional insights can make a big difference. Green Genius offers consultations to help you optimise your setup. Their team can assist with automated monitoring, create tailored nutrient management plans, implement data-based maintenance strategies, and address any imbalances. Regular reviews ensure your system keeps up with your operation's changing demands, improving efficiency and boosting production.
Summary
Visualising pH and EC data effectively is key to managing hydroponic systems. With digital tools, growers can now monitor these critical metrics quickly and accurately, ensuring better control over their systems.
Accurate data visualisation helps growers:
- Track daily changes in pH and EC
- Spot trends that could impact plant health
- Adjust nutrients based on specific crop needs
- Address potential problems before they affect crops
Since different crops thrive under specific pH and EC levels, keeping detailed records is crucial for maintaining optimal conditions. Consistent monitoring and clear data presentation lead to healthier plants and higher yields, all while conserving water compared to traditional farming methods.
For tailored advice on using these techniques, Green Genius offers consultations to help growers optimise their monitoring systems and maintain ideal conditions.
Prioritise regular checks, interpret data carefully, and make timely adjustments to keep your hydroponic system running smoothly.
FAQs
How can I maintain stable pH and EC levels in my hydroponic system during Australia’s extreme weather conditions?
Managing pH and EC levels during extreme weather in Australia requires careful monitoring and adjustments to ensure optimal plant growth. Temperature fluctuations can directly impact nutrient uptake, so it’s important to regularly check both pH and EC levels using reliable meters. Aim to measure at consistent times each day for accurate tracking.
To stabilise conditions:
- Use insulated reservoirs to minimise temperature changes in your nutrient solution.
- Adjust nutrient concentrations if needed, as higher temperatures can increase evaporation and affect EC levels.
- Consider adding buffering solutions to maintain pH within the ideal range (typically 5.5–6.5 for most hydroponic crops).
During heatwaves, keep your grow area cool with shade cloths, ventilation, or cooling systems. For colder periods, use water heaters to maintain the nutrient solution's temperature. Regular adjustments and proactive measures will help protect your plants from weather-related stress.
Why should I use advanced digital monitoring systems instead of basic tools to track pH and EC levels in hydroponics?
Advanced digital monitoring systems offer several key advantages over basic tools for managing pH and EC levels in hydroponics. These systems provide greater accuracy and consistency, ensuring your plants are always in the optimal growing conditions. They also often include features like real-time data tracking, automated alerts, and historical data logging, which can help you identify trends and make informed decisions about your setup.
In addition, advanced systems save time and effort by reducing the need for manual testing and adjustments. This is especially beneficial for larger or more complex hydroponic systems. By investing in reliable digital monitors, you can enhance productivity and achieve better results with less guesswork.
How can I use pH and EC data visualisations to improve plant health and boost yields in my hydroponic system?
Visualising pH and EC (electrical conductivity) data is an effective way to monitor and optimise the health of your hydroponic system. By regularly tracking these metrics, you can identify trends and make adjustments to maintain ideal growing conditions for your plants.
For pH, aim to keep the levels within the optimal range for your specific crops, typically between 5.5 and 6.5. If the pH drifts outside this range, it can affect nutrient uptake, leading to deficiencies or toxicities. For EC, ensure it reflects the right concentration of nutrients in your solution - too high could indicate over-fertilisation, while too low might suggest insufficient nutrients.
Using tools like digital pH and EC meters, combined with software or apps for data tracking, can help you spot patterns and take timely action. Green Genius offers a range of hydroponic tools and resources to support these efforts, helping you create a thriving, sustainable setup tailored to your gardening needs.
Related posts
- Ultimate Guide to EC Monitoring in Hydroponics
- Checklist for Maintaining pH and EC in Hydroponics
- pH and EC Levels by Growth Stage: Chart
- How to Monitor Nutrient Levels in Aeroponics